Feedback Loops
Systems thinking (Norbert Wiener, Jay Forrester, Donella Meadows)
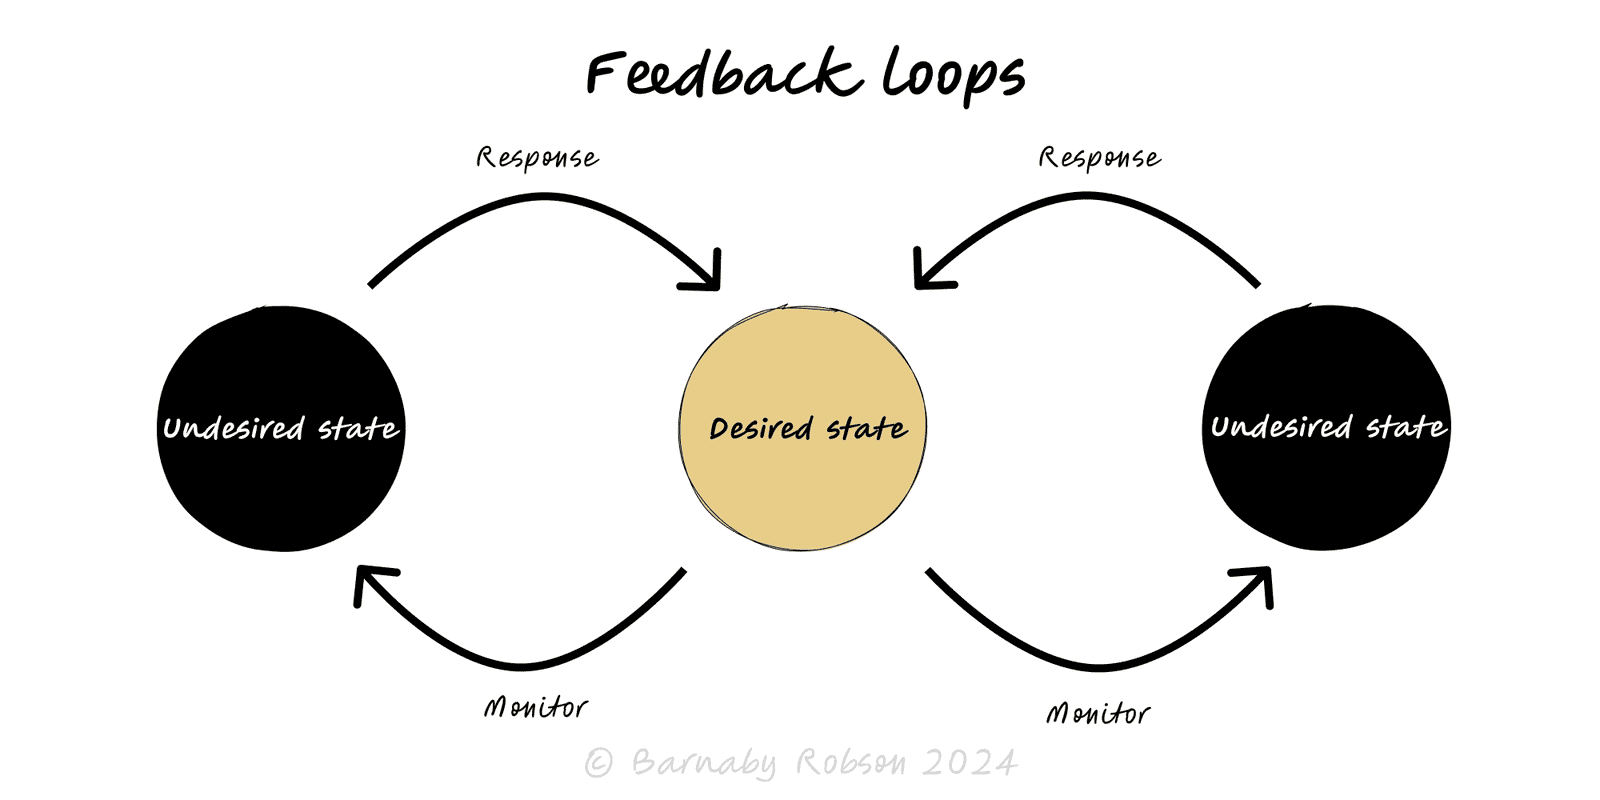
A feedback loop occurs when outputs of a system influence its future inputs. Two core types govern behaviour: reinforcing (positive) loops that accelerate change (growth or collapse) and balancing (negative) loops that stabilise around a target. Because loops interact and often include delays, systems can overshoot, oscillate, or tip into runaway outcomes. Mapping loops makes complex behaviour legible and steerable.
Reinforcing (R) loops – “the more you have, the more you get” (compounding users → more content → more users). Left unchecked, they tend towards exponential growth or free-fall.
Balancing (B) loops – push towards a goal or constraint (thermostat, inventory reorder rules).
Delays – perception, approval, shipping or learning lags make control sluggish and cause overshoot.
Limits & saturation – carrying capacity, budgets, attention; R loops flatten into S-curves.
Cascades & tipping points – multiple R loops can reinforce each other; small changes flip regimes.
Representations – causal loop diagrams (CLDs: arrows with +/−), and stock–flow models (levels, inflows, outflows).
Product & growth – acquisition ↔ engagement ↔ referrals; abuse/spam feedback; creator or marketplace flywheels.
Operations & supply chains – WIP ↔ wait times; reorder rules; bullwhip effects.
Reliability – incidents ↔ load ↔ retries; rate limits and circuit breakers as balancing loops.
Finance & risk – leverage ↔ asset prices; liquidity spirals; risk controls as dampers.
People & performance – coaching ↔ competence ↔ autonomy; burnout spirals and recovery loops.
Policy – congestion pricing, public health R<1 targets, housing supply vs price.
Define the outcome (“stock”) – e.g., active users, cash, backlog, error rate.
Map drivers – sketch a CLD with key variables and +/− links; mark R and B loops explicitly.
Find delays & limits – where are perception/approval/production lags? what hard caps exist?
Locate leverage points – targets/thresholds, gain on controllers (how strongly B loops act), friction on harmful R loops.
Design interventions
Strengthen B loops that enforce goals (SLOs, rate limits, reorder points with buffers).
Grease helpful R loops (referrals, learning, content creation) until you near constraints.
Insert dampers (queues, quotas, circuit breakers) to prevent oscillation or runaway.
Instrument – track leading indicators for loop strength (e.g., referral k-factor, WIP, utilisation, retry rates).
Test & tune – run safe-to-fail changes; watch for new oscillations after parameter tweaks.
Revisit periodically – loops drift as context, tech and incentives change.
Linear thinking – treating curved dynamics as straight lines; ignore loops and you mis-forecast.
Delay blindness – fast corrections to slow systems cause whiplash; lengthen review windows or add buffers.
Over-tight control – aggressive B-loop gains create oscillation; tune gently.
Goodhart’s law – a target becomes the game; pair outcome and counter-metric loops.
Unbounded R loops – engagement hacks that later harm trust, quality or safety.
Local fixes, global harm – improving a part (e.g., pushing work forward) inflates queues elsewhere.