Framing Effect
Daniel Kahneman & Amos Tversky (Prospect Theory)

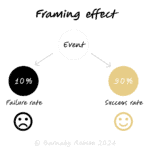
The framing effect is the reliable change in preference when logically equivalent information is presented in different ways (e.g., “90 percent survive” vs “10 percent die”). Under Prospect Theory, people tend to be risk-averse for gains and risk-seeking for losses relative to a reference point, so gain vs loss frames pull choices in opposite directions—even with identical outcomes.
Reference points – outcomes are judged as gains or losses vs a starting point, not in absolute levels.
Loss aversion – losses loom larger than equal gains, so loss frames feel more urgent.
Risk attitude flips – people prefer sure gains but gamble to avoid sure losses (classic disease problem).
Equivalence illusion – “save 200 lives” vs “400 will die” can be mathematically the same yet elicit different choices.
Numbers & denominators – percentages without denominators and relative changes (“−50 percent risk”) exaggerate effects.
Product & pricing – “save £X/year” vs “stop losing £X/year”; trial vs guarantee copy.
Policy & health – uptake of vaccines, screenings, and safety measures changes with gain/loss wording.
Risk & compliance – incident comms, SLAs, and control descriptions influence acceptance.
Sales & negotiation – discount vs surcharge frames; bundled value vs itemised costs.
Org change – adoption improves when benefits are concrete and losses are cushioned.
Show both frames – present gain and loss versions side-by-side; state they are equivalent.
Use absolutes with denominators – prefer “3 in 1,000” over “0.3 percent”; include base rates.
Standardise wording – fixed templates for options, risks and metrics; avoid emotive terms.
Pre-commit criteria – decide evaluation rules (KPIs, thresholds) before seeing framed options.
Blind labels where possible – hide “treatment/control” names in reviews; test copy with A/Bs.
Anchor the reference point – write the status quo explicitly so gains/losses are clear and comparable.
Stress-test decisions – re-check if the choice holds when reframed, or when numbers are converted to the other format.
Educate with examples – include a “90 percent vs 10 percent” note in decision templates to remind reviewers.
Accidental manipulation – one-sided framing biases stakeholders; publish the dual frame by default.
Relative-only stats – “risk reduced 50 percent” without baseline size misleads; add absolute risk reduction.
Unstated denominators – percentages with tiny bases distort.
Frame drift – different teams use different copy; lock templates.
Over-correction – drowning users in formats; keep to two frames + absolute numbers.