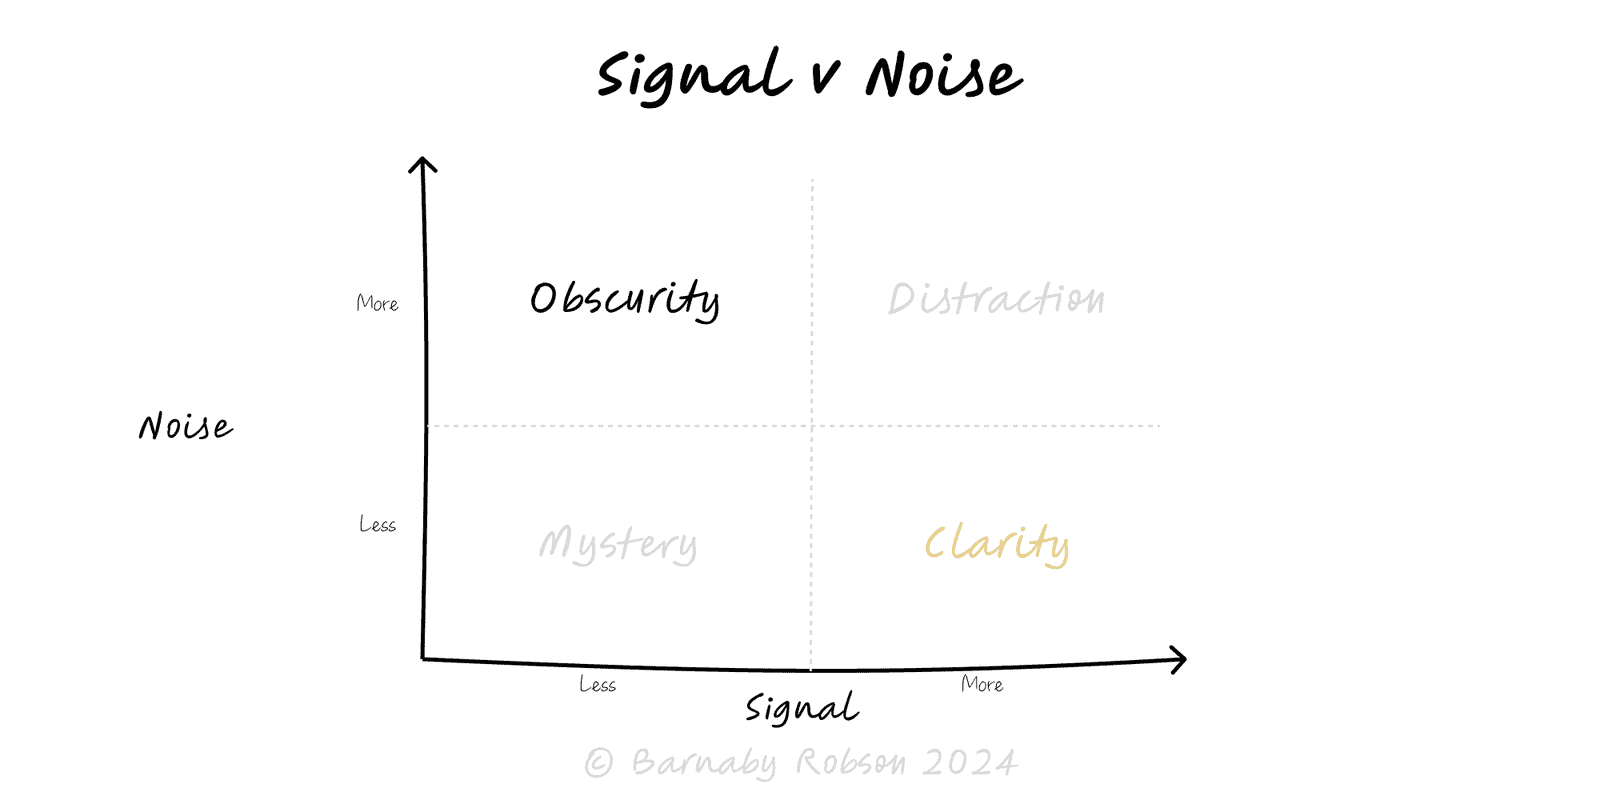
Signal versus noise
General usage across stats, engineering, finance
Every metric mixes signal (systematic effect) with noise (random variation, measurement error, short-term churn).
Decisions improve when you size typical variation first, then require movements to exceed it before you change course.
Signal – consistent pattern caused by a mechanism (trend, seasonality, causal impact).
Noise – random/unsystematic variation from sampling, timing, or measurement error.
Signal-to-noise ratio (SNR) – strength of effect vs variance; low SNR needs more data or stronger designs.
Smoothing/aggregation – moving averages, EWMA, weekly cohorts reduce noise to reveal trend.
Control limits – define expected bounds (e.g. ±3σ). Points outside likely indicate signal.
Bias–variance trade-off – more smoothing reduces variance but can hide real changes (lag).
Multiple comparisons – many metrics/tests inflate false positives; control with pre-specification or correction.
Dashboards – show trend + control limits so leaders don’t chase random wiggles.
A/B tests – require pre-set power, minimum detectable effect, and stopping rules.
Forecasting – decompose time series (trend/seasonality/residual) before modelling.
Ops quality – SPC charts to detect real process shifts vs common-cause variation.
Investment & diligence – distinguish narrative noise from persistent unit-economic shifts.
Define the question and horizon (daily noise tolerable, weekly actionable?).
Baseline variability – estimate typical range (σ/IQR) or seasonality pattern.
Set detection rules – e.g. “act if 2 consecutive weeks outside control limits”.
Smooth appropriately – use 7-day/28-day averages or cohort windows aligned to behaviour.
Pre-commit – metrics, MDE, duration; avoid peeking and KPI-shopping.
Instrument decisions – log when a move was triggered by signal and measure post-effect.
Chasing wiggles – reacting within expected variance (common-cause).
Bad denominators – ratio changes from traffic mix masquerade as signal.
Seasonality confusion – weekly/holiday effects misread as trends.
Multiple testing – fishing across many cuts inflates false positives.
Over-smoothing – hiding real step-changes; review lag vs sensitivity.