Supply and Demand
Classical and neoclassical economics (Smith, Marshall, Walras)
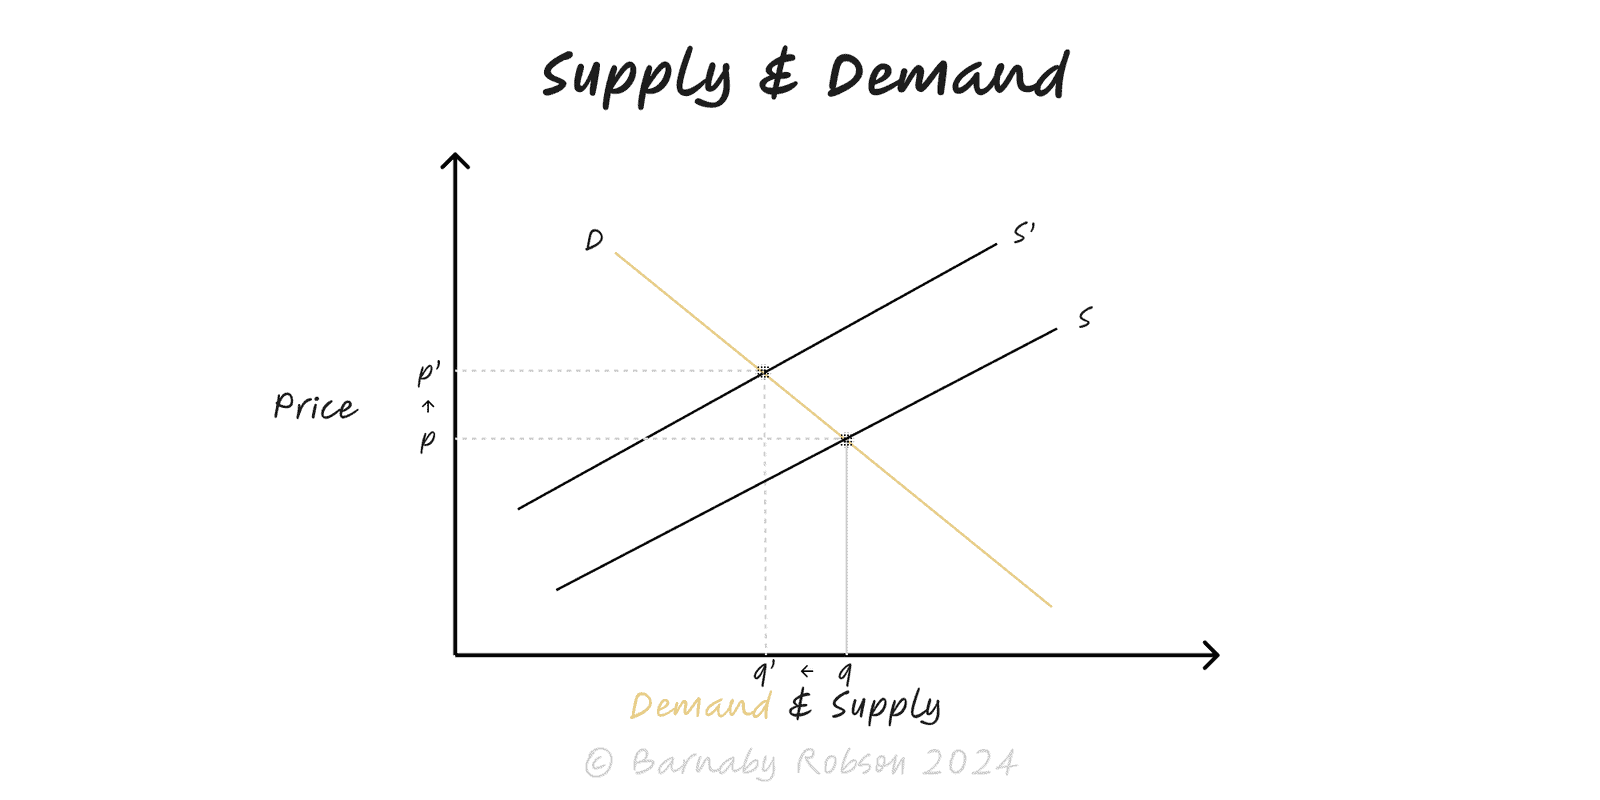
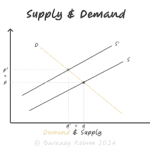
The basic market model: a downward-sloping demand curve and upward-sloping supply curve intersect at equilibrium price and quantity. Policy, technology, preferences, and constraints shift curves; elasticities govern sensitivity.
Demand – quantities buyers will purchase at each price. Shifters: income, preferences, substitutes/complements, expectations, population.
Elasticity (price): %ΔQ / %ΔP. High elasticity → volume moves more than price.
Cross-elasticity: response to other goods’ prices (subs/complements).
Supply – quantities sellers will offer at each price. Shifters: input costs, technology, capacity, regulation/taxes, expectations.
Elasticity: short run often inelastic (capacity fixed), long run more elastic (investment possible).
Equilibrium – intersection (P*, Q*). Surplus if P > P*, shortage if P < P*.
Incidence: who bears taxes/subsidies depends on relative elasticities.
Price controls: floors (surplus), ceilings (shortage) when binding.
Pricing and revenue – estimate own- and cross-elasticities; choose price moves vs volume goals.
Capacity & capex – gauge supply elasticity and lead times before committing investment.
Commercial diligence – test demand shifters, pass-through, and competitor supply responses.
Product & GTM – identify substitutes/complements; design bundles and versioning.
Policy & contracts – model tax, tariff, or rebate incidence; set escalation clauses.
Marketplace/platforms – balance two-sided supply and demand; manage surge/constraints.
Define the market – product, segment, geography, time frame (short vs long run).
Measure – gather price–quantity data; identify substitutes/complements; note capacity limits.
Estimate elasticities – own-price, cross-price, and income where relevant.
Identify shifters – tech, input costs, regulation, seasonality; separate shifts from movements along curves.
Simulate scenarios – apply shocks (±% to shifters); compute new equilibrium and split between P vs Q.
Decide levers – price change, promo, mix, capacity, contracts (indexation, floors/ceilings).
Confusing shifts with movements – a price change moves along a curve; shifters move the curve.
Ignoring heterogeneity – elasticity differs by segment, channel, and time horizon.
Capacity & frictions – short-run supply is often kinked by bottlenecks and lead times.
Averages vs marginals – decisions ride on marginal effects, not historical averages.
Externalities & controls – taxes, quotas, or price caps change outcomes and incidence.
Linear comfort – relationships are often non-linear; watch for thresholds/tipping points.